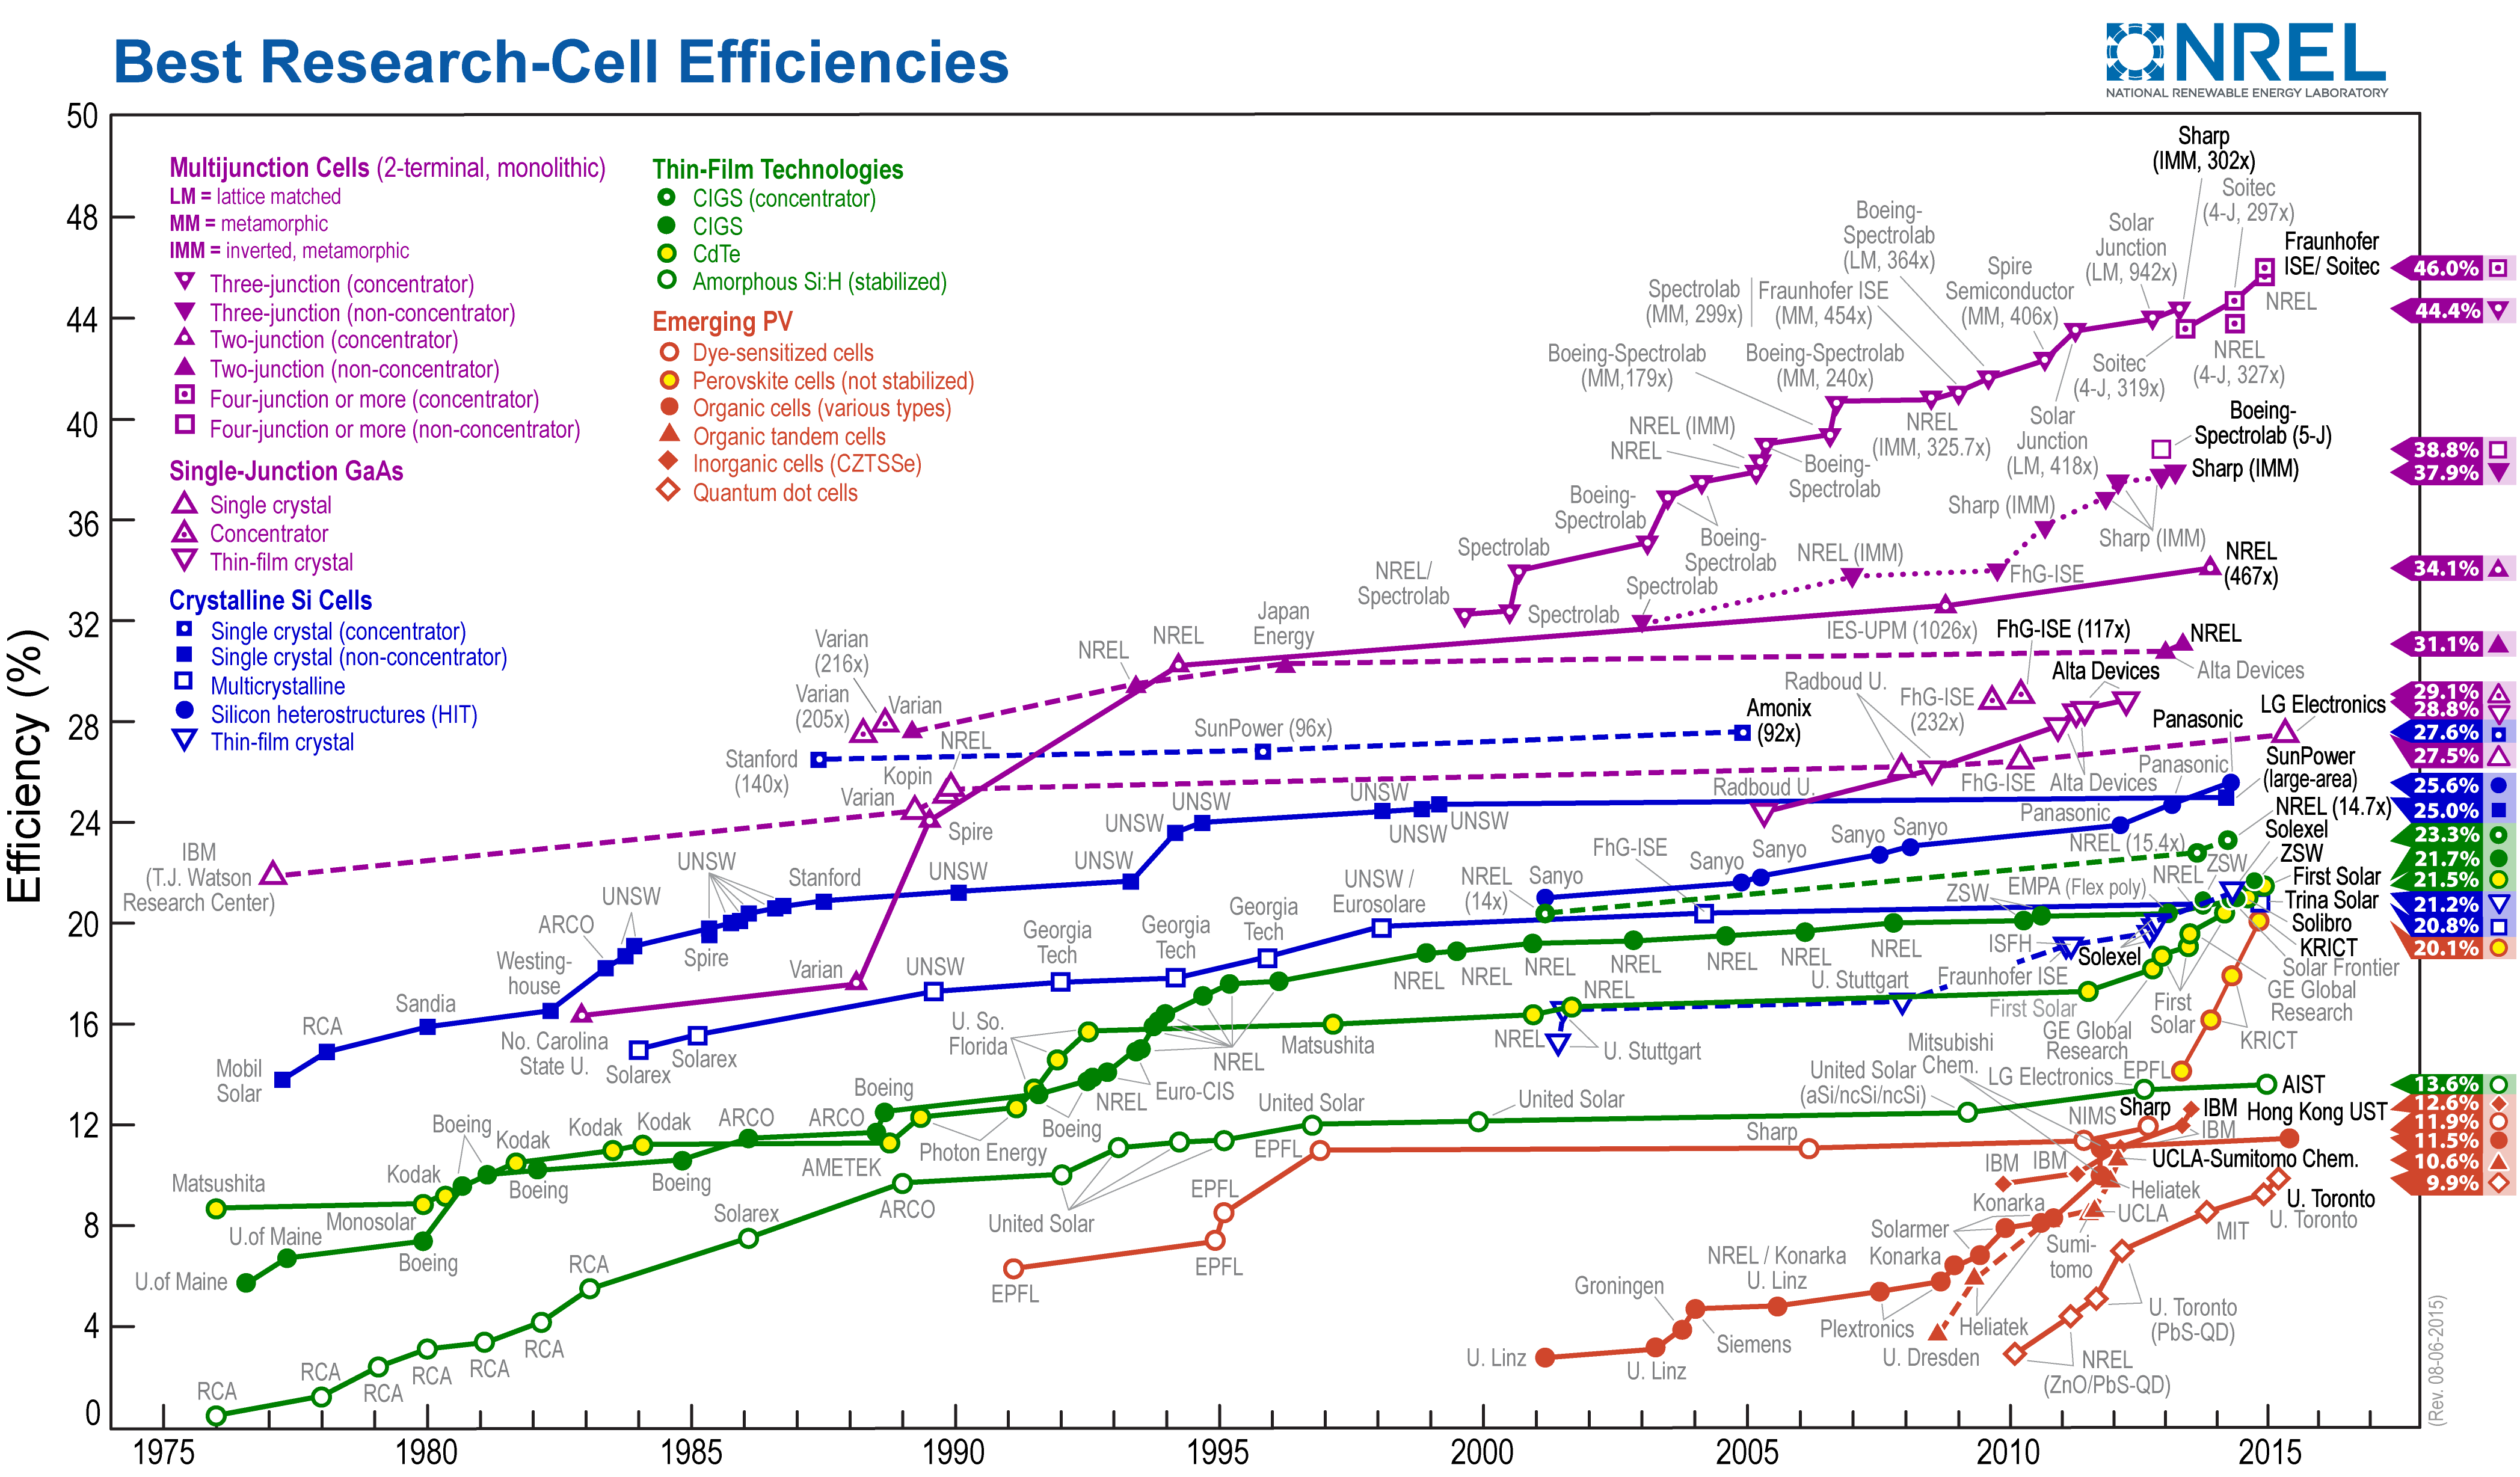
The short answer to the questions from the last section is, No. Take a look at the Chart from the National Renewable Energy Lab below.
(Click to get a better view.)
At first glance, it is a little confusing since there are so many types of solar technologies. It also appears that some are still improving their efficiency curves.
Of the 20 lines on the chart, two lines matter. These lines account for 85% of all Solar energy installed today (as we will see in the next section).
The two lines are the dark blue line in the middle with the solid blue squares, Crystalline Si Cells (Single crystal, non-concentrator) and the dark blue line just below it with the open blue squares, Crystalline Si Cells (Multicrystalline).
The top line (Crystalline Si Cells, Single crystal, non-concentrator) has an efficiency of 25% in the lab.
In the real world, it's widely accepted to be closer to 15%.
85% of Solar energy installed today has a top-line efficiency of 15%, and it's essentially been flat since 1995. It is stuck, and it is not going to improve much beyond this level.
The reason it has been stuck for so long is that it is close to reaching its theoretical limit. The Shockley-Queisser Limit is the maximum theoretical efficiency of a solar cell. The limit is 33.7% [3]
You may think, hey wait a minute, look at Multi-Junction PV and other Emerging PV! Unfortunately, neither is close to being a significant portion of the install base, and neither shows any sign of changing that fact. We cannot include them in any strategic plans at this point in time.
Maybe 15% efficiency is enough to provide for a significant portion of our energy needs. Efficiency may turn out to be irrelevant. However, efficiency improvement is an important factor in predicting Solar energy growth possibilities, and it is clear that efficiency has been stuck at 15% for 20 years, and unlikely to improve much in the future (assuming majority of install is Crystalline Si Cell).
Next, let's take a closer look at the various Solar technologies. It's simpler than it looks in the NREL chart.
